

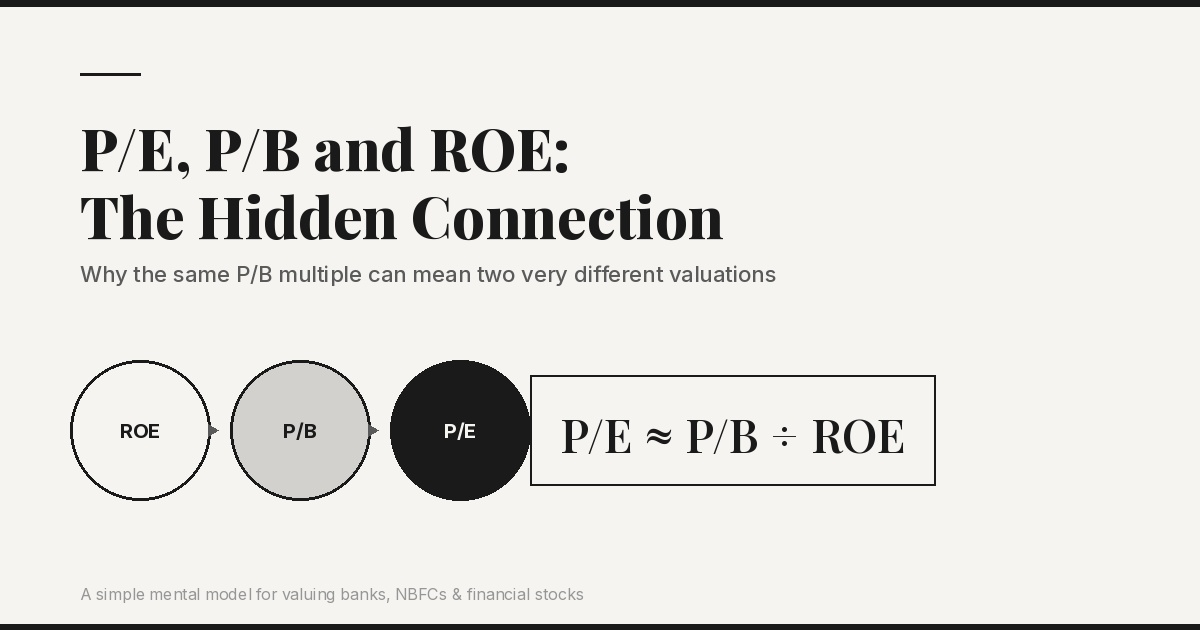
When investors analyse a stock, they often come across three numbers:
P/E, P/B and ROE.
We usually learn them separately.
- P/E tells us how much investors are paying for a company’s earnings.
- P/B tells us how much investors are paying for the company’s book value.
- ROE tells us how efficiently the company is using shareholders’ money.
But these three numbers are not independent.
In fact, there is a simple relationship between them that can help us understand why a company deserves a particular valuation.
The relationship is especially useful when analysing banks, NBFCs and other financial companies, where book value and shareholders’ equity are central to the business.
Let’s understand it with a simple example.
First, What Is ROE?
ROE stands for Return on Equity.
The basic formula is:
ROE = Profit After Tax ÷ Shareholders’ Equity
Suppose a company has shareholders’ equity of ₹100 crore and earns ₹15 crore in profit.
Its ROE is:
₹15 crore ÷ ₹100 crore = 15%
In simple terms, the company is generating ₹15 of profit for every ₹100 of shareholders’ capital.
This tells us something very important about the business:
How efficiently is the company using the money belonging to its shareholders?
A company that consistently earns a high ROE is generally using its capital more productively than a company earning a low ROE, although ROE should always be evaluated along with debt, risk and the nature of the business.
What Is P/B?
P/B stands for Price-to-Book ratio.
The formula is:
P/B = Market Value of Equity ÷ Book Value of Equity
Let’s say a company has a book value of ₹100 crore.
But the stock market values the company at ₹300 crore.
Then:
P/B = ₹300 crore ÷ ₹100 crore = 3×
This means investors are willing to pay ₹3 in the market for every ₹1 of the company’s book value.
At first glance, 3× book might appear expensive.
But that conclusion would be incomplete.
The important question is:
What is the company earning on that ₹100 crore of book value?
This brings us back to ROE.
The Connection Between P/B and ROE
Suppose the company has:
- Book value = ₹100 crore
- Profit = ₹15 crore
- ROE = 15%
- Market value = ₹300 crore
- P/B = 3×
An investor is paying ₹300 crore for a company generating ₹15 crore of annual profit.
So the earnings yield on the price paid is:
₹15 crore ÷ ₹300 crore = 5%
The inverse of 5% is:
1 ÷ 5% = 20×
So the company’s P/E is approximately 20×.
Now look at the relationship:
P/B ÷ ROE
= 3 ÷ 15%
= 20×
Therefore:
P/E ≈ P/B ÷ ROE
This simple relationship is extremely useful.
It helps us see how the three ratios are connected rather than treating them as completely separate numbers.
Why Does This Matter?
Because P/B cannot be judged without considering ROE.
Consider two companies.
Company A
- P/B = 3×
- ROE = 10%
Approximate P/E:
3 ÷ 10% = 30×
Company B
- P/B = 3×
- ROE = 20%
Approximate P/E:
3 ÷ 20% = 15×
Both companies trade at exactly 3× book value.
But their economics are completely different.
Company A generates ₹10 of profit for every ₹100 of equity.
Company B generates ₹20.
Therefore, the same P/B multiple can represent very different valuations depending on the company’s ROE.
This is one reason why simply saying:
“The stock trades at 3× book, so it is expensive.”
is not enough.
You need to ask:
“What ROE am I getting for that valuation?”
Think About It Like Buying a Business
Imagine two small businesses.
You can buy both for ₹300.
Business A
Its assets or book value are worth ₹100.
It generates ₹10 profit every year.
Business B
Its assets or book value are also worth ₹100.
But it generates ₹20 profit every year.
You are paying the same ₹300 for both businesses.
Which one would you prefer?
Probably Business B.
Why?
Because it is generating twice as much profit from the same amount of capital.
That’s essentially what ROE helps us understand.
What Happens When ROE Improves?
This is where the relationship becomes even more interesting.
Suppose a company trades at:
3× P/B
and has:
12% ROE
Approximate P/E:
3 ÷ 12% = 25×
Now imagine that the company improves its business and ROE rises to 15%.
If the P/B remains at 3×:
3 ÷ 15% = 20×
Notice what happened.
The company’s P/B hasn’t changed.
But the implied P/E has fallen from approximately 25× to 20× because the company is now generating more profit from its equity.
In other words:
Improving profitability can make the valuation more attractive even when the share price has not fallen.
And What If the Market Re-Rates the Stock?
Suppose the company has improved its ROE from 12% to 15%.
Investors now believe that the higher ROE is sustainable.
They may become willing to pay a higher P/B.
Suppose P/B increases from:
3× → 3.5×
At 15% ROE:
P/E ≈ 3.5 ÷ 15%
≈ 23.3×
The company now has:
- Higher ROE
- Higher P/B
- Stronger profitability
This is an example of valuation re-rating.
If earnings are also growing rapidly, shareholders can benefit from both:
Earnings growth + Valuation re-rating
That combination can produce very strong returns.
But Valuation Re-Rating Is Not Guaranteed
This is where investors need to be careful.
Suppose a stock historically traded at:
40× P/E
and today trades at:
25× P/E
It is tempting to conclude:
“The stock is undervalued because its historical P/E was 40×.”
But historical valuation alone doesn’t tell us what the stock should be worth today.
Perhaps the company previously had:
- Higher ROE
- Faster growth
- Better margins
- Lower risk
- Stronger competitive advantages
- Better economic conditions
If those factors have changed, the old 40× P/E may no longer be appropriate.
Therefore, historical valuation should be treated as a reference point, not a guaranteed fair value.
The Importance of ROE
ROE becomes particularly important when a company trades at a high P/B.
Suppose:
Company X
P/B = 5×
ROE = 10%
Approximate P/E:
5 ÷ 10% = 50×
That is a very demanding valuation.
Now consider:
Company Y
P/B = 5×
ROE = 25%
Approximate P/E:
5 ÷ 25% = 20×
Both companies trade at 5× book.
But the second company is generating substantially more profit from its equity.
Therefore, a high P/B doesn’t automatically mean a stock is expensive.
The quality of the earnings generated from that book value matters.
ROE and Growth Are Also Connected
There is another useful concept investors should know.
A simplified version of sustainable growth is:
Sustainable Growth ≈ ROE × Retention Ratio
Suppose a company has:
ROE = 15%
and retains 80% of its profits.
Then:
15% × 80% = 12%
The company’s equity can potentially grow at around 12% through internally generated profits, assuming the relationship remains broadly stable.
Now imagine ROE increases to 20%.
With the same 80% retention:
20% × 80% = 16%
Higher ROE can therefore support faster internal growth.
This is why ROE isn’t simply a measure of past profitability.
A sustainable high ROE can become an important driver of future compounding.
The Multibagger Connection
Now let’s connect all of this to something every investor is interested in:
Can a stock become a multibagger?
Suppose a company currently earns:
₹100 crore
and trades at:
25× P/E
Its market capitalisation is:
₹2,500 crore
Now suppose its earnings compound at 18% annually for 10 years.
₹100 crore becomes approximately:
₹524 crore
If the P/E remains at 25×:
₹524 crore × 25 = ₹13,100 crore
The market capitalisation has increased from:
₹2,500 crore → ₹13,100 crore
That’s more than 5×.
Notice something important:
The company didn’t require a higher valuation multiple.
The return came primarily from earnings growth.
This is an important lesson for investors.
You don’t necessarily need to find a stock that will be re-rated from 20× to 40×.
If the underlying business can compound earnings fast enough, the stock can still become a multibagger.
What If the P/E Falls?
Now suppose the same company grows earnings from ₹100 crore to ₹524 crore over 10 years.
But instead of maintaining 25× P/E, the market values it at only 20×.
Market capitalisation becomes:
₹524 crore × 20 = ₹10,480 crore
Even after the valuation multiple falls, the company has grown from ₹2,500 crore to ₹10,480 crore.
That’s still more than 4×.
This is an important point:
Strong earnings growth can overcome valuation compression.
And the opposite is also true.
A company with weak earnings growth may struggle to generate good returns even if investors are initially paying a reasonable P/E.
Two Engines of Stock Returns
This gives us a simple way to think about long-term returns.
Engine 1: Business Growth
- Revenue growth
- Profit growth
- Book-value growth
- ROE
- Cash-flow growth
Engine 2: Valuation Change
- P/E expansion or contraction
- P/B expansion or contraction
The first engine is driven primarily by the underlying business.
The second is driven by what investors are willing to pay for that business.
As investors, we should ideally look for companies where the business-growth engine is strong enough to generate attractive returns without depending entirely on valuation expansion.
That gives us a stronger margin of safety.
A Simple Framework for Investors
When you analyse a company, particularly a bank or NBFC, don’t look at P/E, P/B and ROE separately.
Ask these questions together:
1. What is the ROE?
Is it 8%, 12%, 15% or 20%?
2. What P/B am I paying?
Are you paying 1.5×, 2×, 3× or 5× book?
3. Does the ROE justify the P/B?
A 4× P/B with 10% ROE deserves much more scrutiny than a 4× P/B with 20% ROE.
4. Can ROE improve?
If ROE is currently 10%, can the business realistically reach 15%?
5. Can ROE be maintained?
A temporary spike in ROE is very different from a sustainably high ROE.
6. How fast can book value grow?
Book-value growth is particularly important for financial companies.
7. How fast can earnings grow?
Understand what is actually driving the earnings growth.
8. What valuation are you assuming?
Don’t simply assume that the historical P/E will return.
Use bear, base and bull scenarios.
9. Finally, what return does all of this imply?
Calculate:
Future Earnings × Future P/E
and, where appropriate:
Future Book Value × Future P/B
Then compare the potential return with the time required to achieve it.
The Three Ratios in One Picture
Think of them this way:
ROE → How efficiently is the company’s capital being used?
↓
P/B → How much are investors willing to pay for that capital?
↓
P/E → How much are investors ultimately paying for the profits generated by that capital?
And the relationship connecting them is:
P/E ≈ P/B ÷ ROE
This isn’t a substitute for proper valuation analysis.
But it is an extremely useful mental model.
Final Takeaway
When you see a company trading at a high P/B, don’t immediately conclude that it is expensive.
Ask:
How much ROE is the company generating?
When you see a company trading at a low P/E, don’t immediately conclude that it is cheap.
Ask:
Why is the market assigning such a low multiple?
And when you see a company with a high ROE, don’t immediately assume it will continue forever.
Ask:
Is that ROE sustainable, and what is allowing the company to earn it?
Ultimately, valuation is about the relationship between the price you pay, the capital employed by the business, the return generated on that capital, and the growth that can be sustained.
Remember this:
P/E tells you what you are paying for earnings.
P/B tells you what you are paying for the company’s book value.
ROE tells you how productively that book value is being used.
And the simple relationship:
P/E ≈ P/B ÷ ROE
helps connect all three.
Once you understand this relationship, financial-sector valuation becomes much less about memorising ratios and much more about understanding how the business actually creates value for shareholders.


Leave a Reply